Intro
Hi, my name is Zach. Welcome to my blog, which I have created to document my journey into the world of Data Science. Playing with data and statistics/probability has always been the thing I could do for hours and hours and not realize that any time had passed. I began learning R so that I could dive deeper into this passion of mine. I chose R for the array of open source learning materials and how accessible the community felt. R is also incredibly powerful and friendly to novice programmers (think learning how to ride a bike and doing backflips off of jumps at the end of the first day). I plan to use this outlet to practice my data wrangling and analysis skills in R on datasets that span my many interests.
With that said, here is the first plot that I ever made in R. I tracked the weight of my labrador puppy, Olive, over the first few months of her life and used R to visualize this trend:
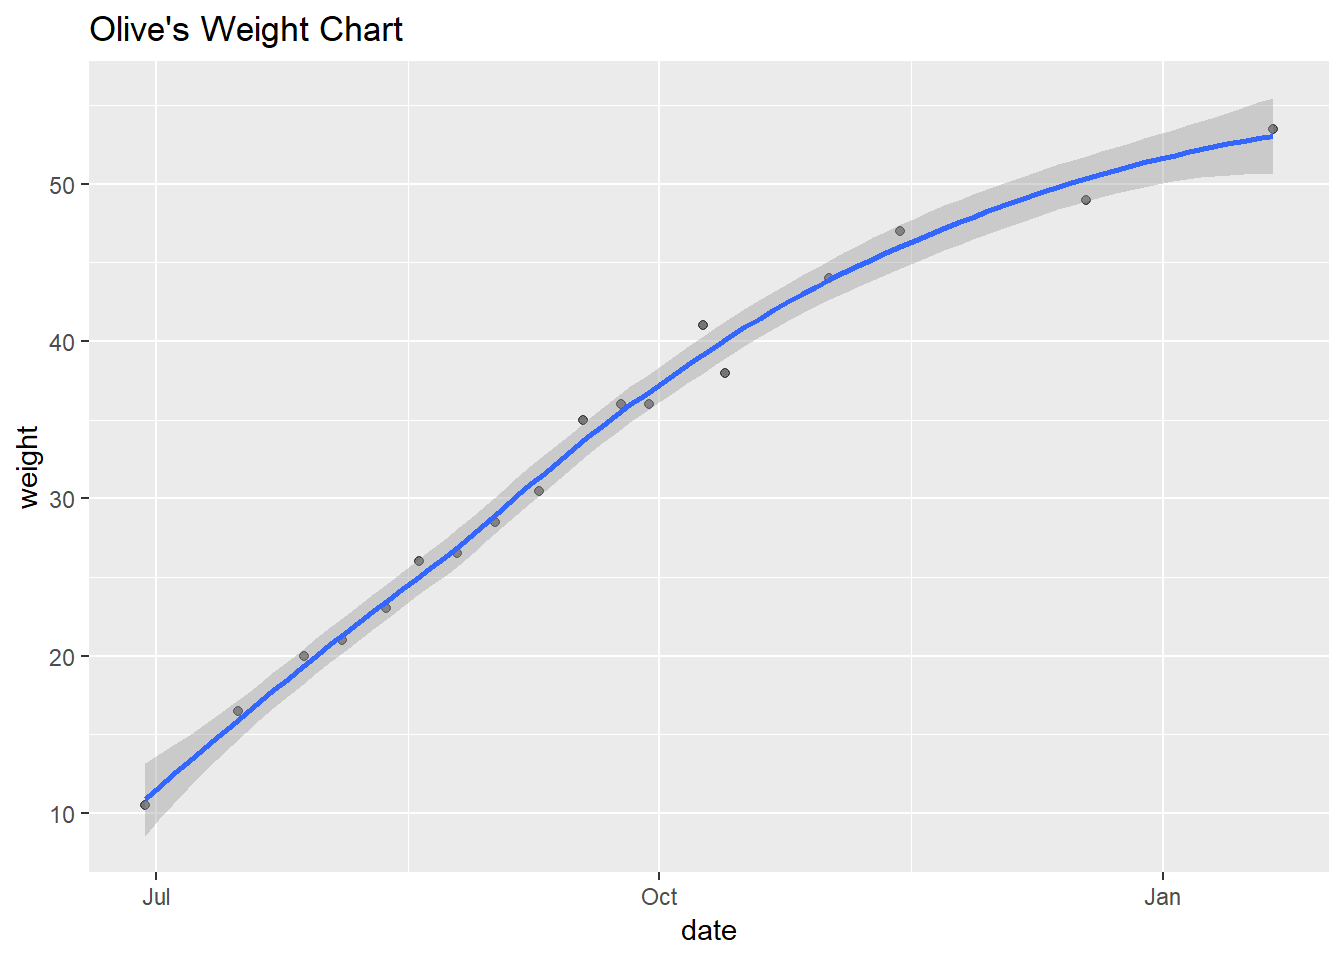
I had just finished reading R for Data Science and had a very vague knowledge of tidyverse data manipulation verbs and knew that they played well with the ggplot function so this was the result (I hadn’t learned much about formatting yet…) It might not be much, but I realized from this simple exercise how powerful R could be and I absolutely had to learn more.
After that, I did some more reading and became very excited by the concept of the pipe operator, as you can see from the code below, and came up with a visualization that shows the batting average of AL West Division MLB teams from 2011 to 2016, courtesy of data from the Lahman database!
library(tidyverse)
library(Lahman)

#Batting average by team

Batting %>%
  filter(yearID > 2010, lgID == "AL") %>%
  left_join(Teams, by = c("yearID", "teamID")) %>%
  filter(divID == "W" & lgID.x == "AL") %>%
  group_by(yearID, teamID) %>%
  summarise(batavg = round(sum(H.x) / sum(AB.x), 3)) %>%
  ggplot(aes(yearID, batavg, colour = teamID)) +
  geom_point() +
  geom_line() +
  geom_hline(yintercept = 0.3) +
  ggtitle("Batting Average") +
  labs(x = "Year", y = "Batting Average")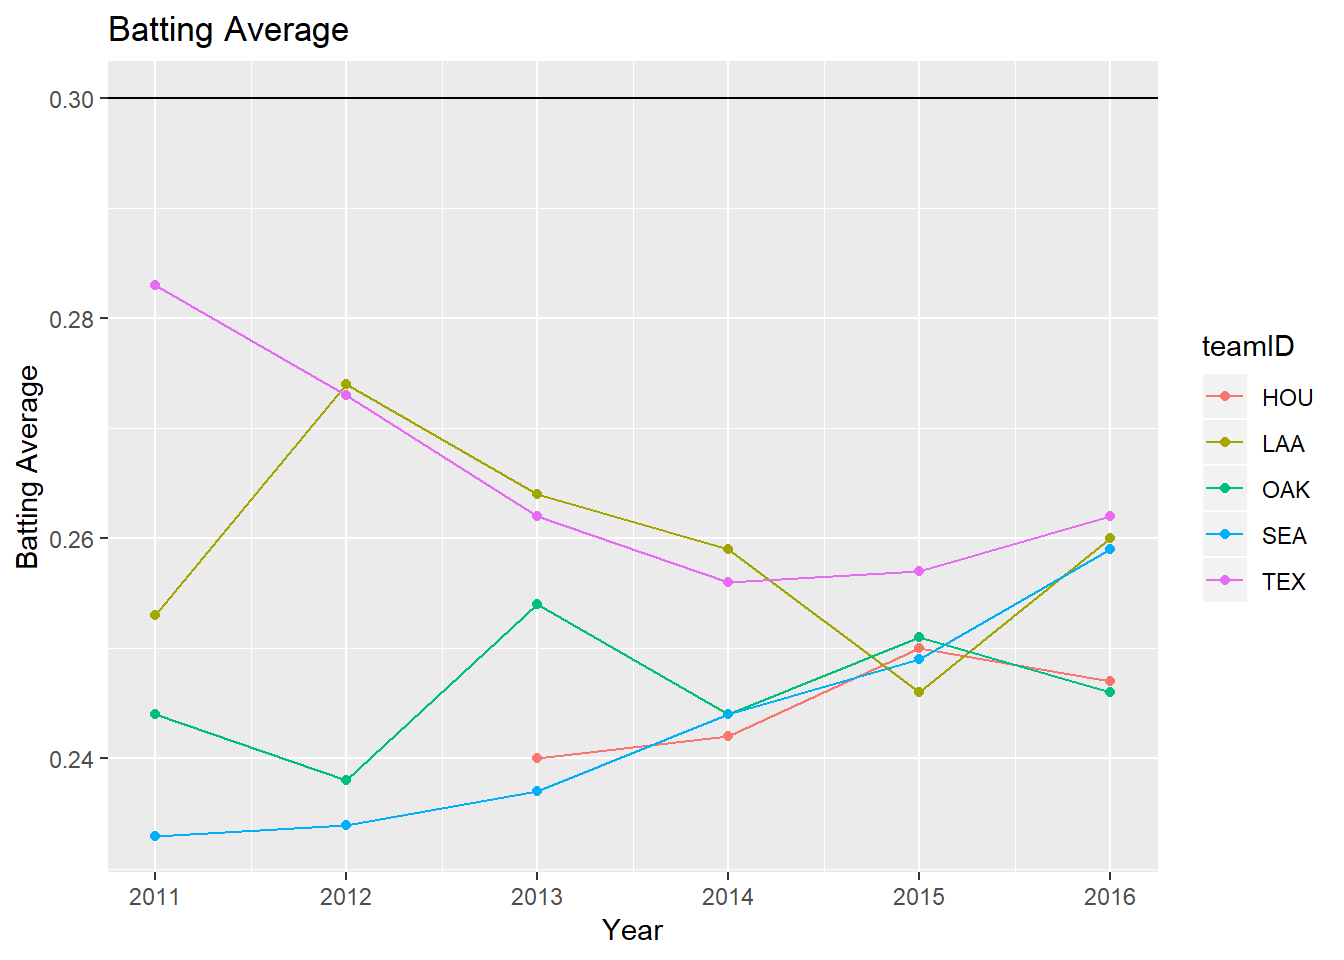
I won’t normally show my code unless I am illustrating a certain new concept I’ve learned or something, but all source material will be available on my Github. Big thanks to Jenny Bryan’s helpful resource on Git & version control and Yihui Xie’s intro to blogdown for helping me get this blog up and running painlessly. I’ll end here for now, I promise the content in future posts will have nicer formatting. Thanks for reading!